How data is boosting WFP’s response to coronavirus
By Arif Husain
The coronavirus pandemic is changing the way we live and work. It's also affecting the World Food Programme's (WFP) life-saving operations across the globe.
The chain that COVID-19 cannot break
In an interview last month, I signalled the potential implications of the disease for the world's interconnected systems and economies. At a time when our ability to continue operating, producing and progressing is dependent on our collective ability to persevere, the potential consequences of COVID-19 are far-reaching.
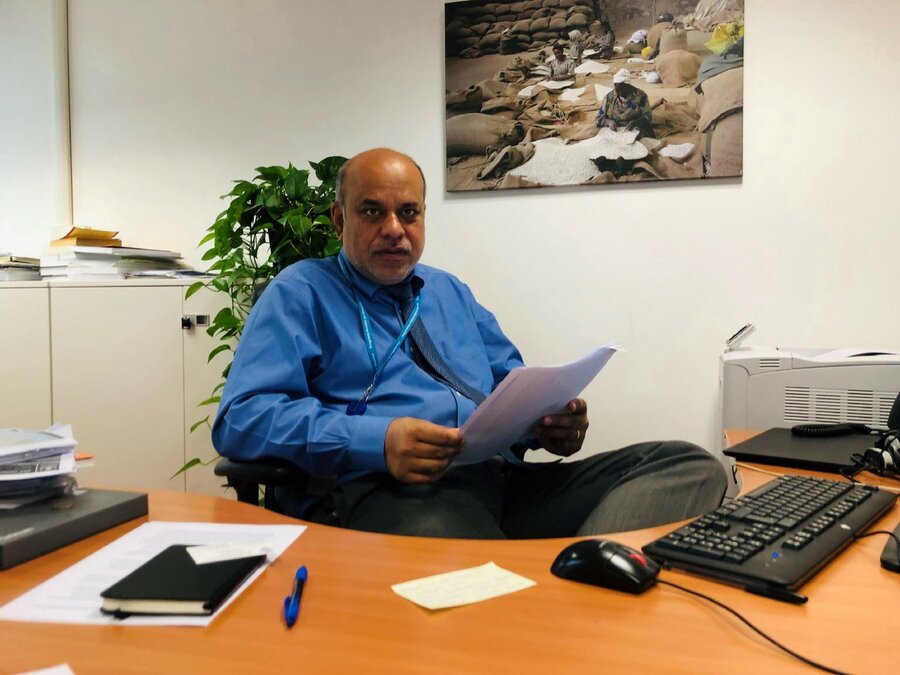
Here in Rome, where WFP is headquartered, we've experienced how quickly circumstances can shift during a COVID-19 outbreak. Timely information has proved a vital resource — data informs how we respond, prepare and adapt.
Ensuring relevant information is available — and easily accessible — to our colleagues and the wider humanitarian community is paramount. Fortunately, having established and interconnected information systems in place across our teams means we can quickly integrate and visualize new data streams while programming our systems to monitor COVID-19.
So in a matter of days, we were able to integrate COVID-19 data from Johns Hopkins University into existing WFP systems that have often been used to inform our work across food security and vulnerability.
Doing so allowed us to draw a wealth of information within the same window. Below are two resources that offer information, insights and analyses of food security and vulnerability, keeping in step with constantly changing circumstances:
1. DataViz Hunger Analytics Hub
WFP's DataViz platform is a one-stop tool where you can do data ‘deep dives' using graphics instead of spreadsheets. For analysts, and indeed others assessing food security, the Hunger Analytics Hub offers a variety of comprehensive real-time data streams in a single window. Click on a tab — such as rainfall, hazards, food security and markets or COVID-19 — and the layer you need on the map shows up.

Through this platform, you can access an overview of COVID-19 caseloads at a global scale and hone in to see national trends. Because of the extent to which you can layer data, you can combine filters that suit your needs. For example, in the case of Lebanon (below) we've drilled down to analyse how COVID-19, conflict and hazards may be affecting the health of markets across districts.
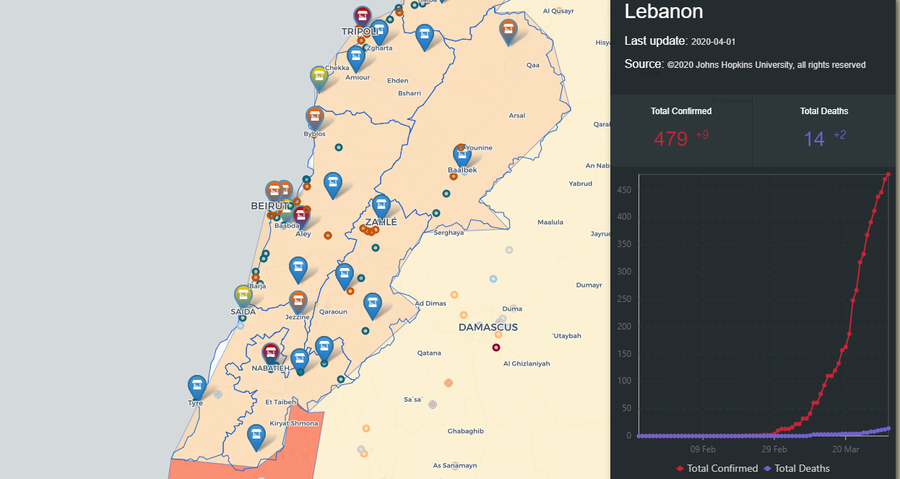
With COVID-19 data now integrated, we hope that our DataViz platform can facilitate faster analyses and support comprehensive assessments.
Hunger Map LIVE
To complement the Hunger Analytics Hub, we are simultaneously monitoring and analysing the evolution of COVID-19 outbreaks in countries where WFP operates — along with most low- and lower-middle income countries — through the recently launched Hunger Map LIVE.
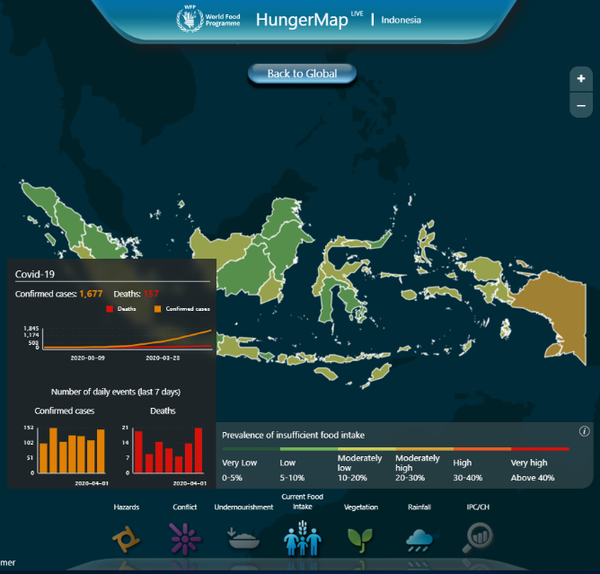
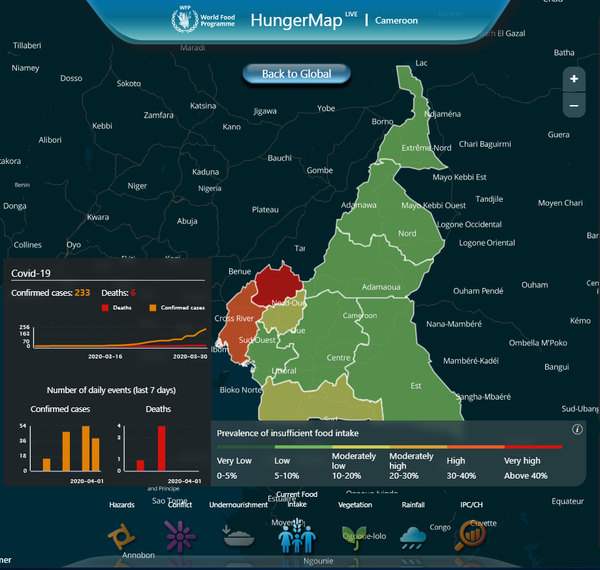
Our own teams have been using WFP's extensive, continuous monitoring systems to collect new COVID-19 data as quickly as possible (see video below).
By using live calls conducted through call centres, and adapting our surveys to capture information relating to COVID-19, we can begin to collect new, relevant data daily.
Soon, this additional COVID-19 data will begin to flow into Hunger Map LIVE, enabling real-time monitoring of the impact of COVID-19 on food security and supply chains. Using this system and its variety of indicators, we hope to capture and signal deteriorating circumstances in different countries.
How to minimize the impact of Coronavirus on food security
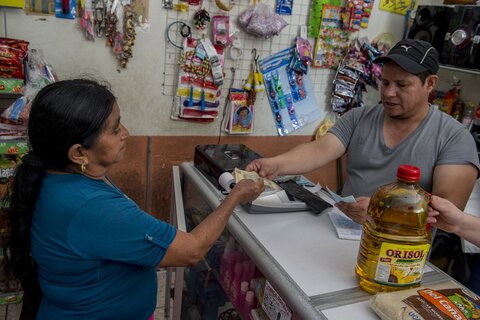
Integrating COVID-19 data is an initial step towards ensuring that our colleagues, and the wider humanitarian community, are well-equipped to conduct the analyses and monitoring which can inform decision-making and our subsequent responses.
In this way, we save lives and change lives. (And there's more to come — stay tuned.)
