WFP launches HungerMap Live

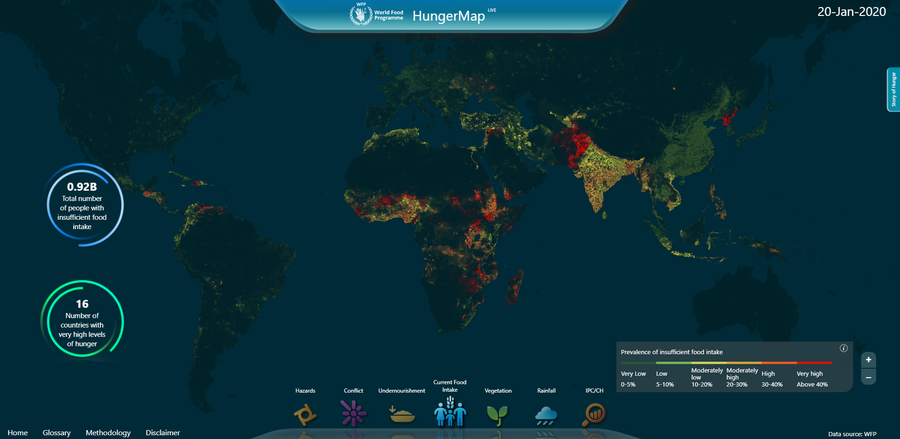
The World Food Programme (WFP) has unveiled a new tool in its bid to end hunger by 2030: HungerMap LIVE monitors food security in more than 90 countries and issues predictions for places where data is limited.
Using the latest metrics on conflict, climate shocks, populations and the weather, HungerMap LIVE aims to identify areas that are currently food insecure or are sliding towards food insecurity.
Where there is limited data available, HungerMap LIVE uses artificial intelligence to supply what have been dubbed "nowcasts"—virtually real-time, granular estimates of the food security situation.

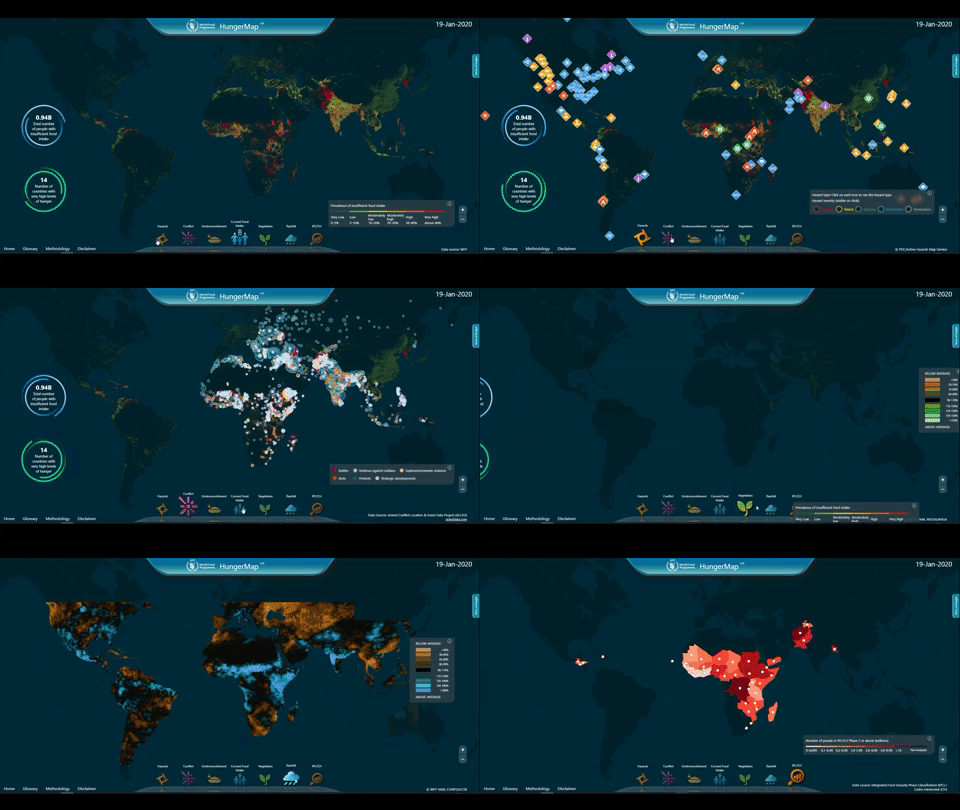
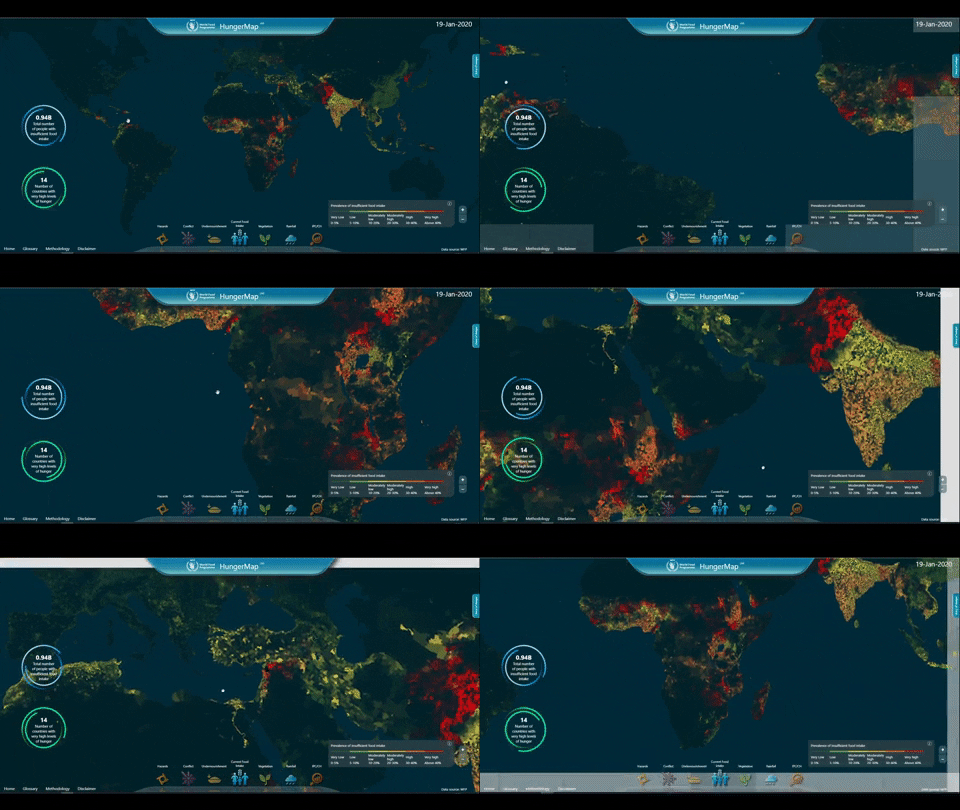
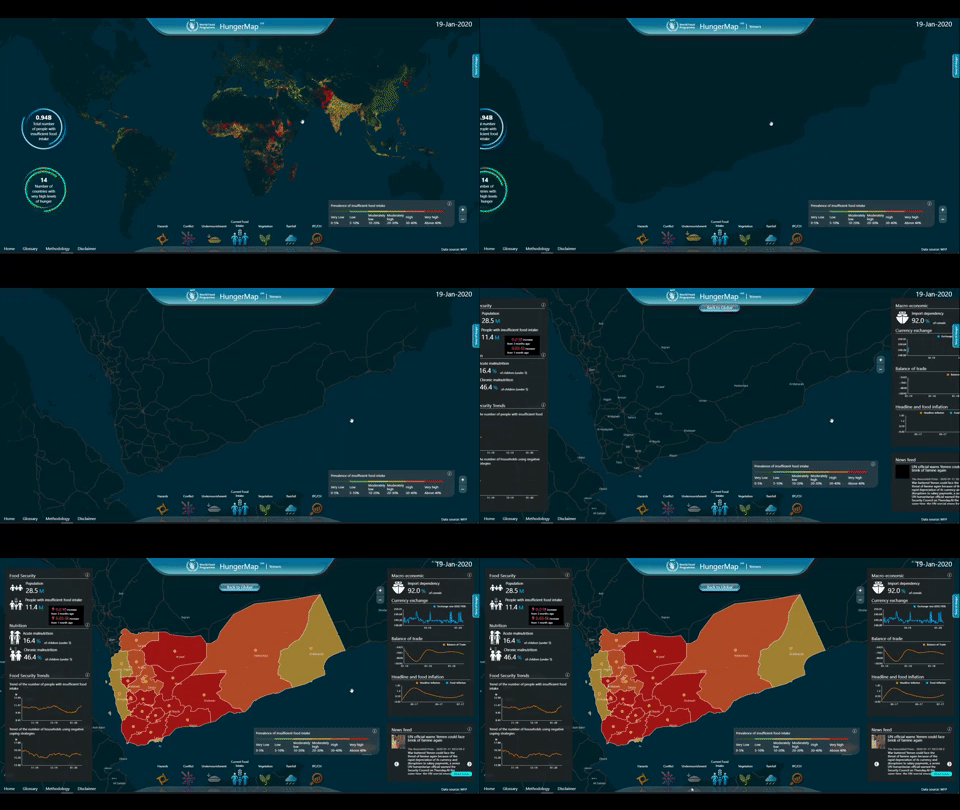
Users are able to "overlay" information to see how different phenomena are interlinked. For example, data about conflict can be overlayed with hunger or seen through the prism of disasters or hazards. HungerMap can hone in on how both national and subnational contexts are faring.

Its indicators and metrics are guided by simple questions such as, "What do you do when you don't have enough food or don't have enough money to buy food?"; and, "Do you know where your next meal will come from?".
Over the past year at the Hunger Monitoring Unit, we have been asking ourselves, "How can we improve the way we understand, monitor and track hunger?"

HungerMap LIVE is a major step towards answering that question.
We established WFP's near real-time food security monitoring systems, which collect daily food security information using live calls conducted through call centres. These systems make it possible to collect data on a continuous basis — offering an assessment method that is cheaper, faster and provides a representative snapshot of the food security situation at any given point in time.
Simultaneously, we pulled together a breadth of indicators and metrics, ranging from hazards data from the Pacific Disaster Centre, population data from the World Bank to vegetation data from NASA, among other sources.
These systems together allowed us to build a unified data warehouse that brings all this information into one place.
Initially using data taken from 63 countries over a 14-year period, we programmed the machine-learning predictive models that inform HungerMap LIVE — covering population density, nightlight intensity, rainfall, vegetation index, conflict, market prices, macroeconomic indicators, and undernourishment.
Food security, currency exchanges, inflation and nutrition are among the many topics the interactive map offers information on.
WFP hopes that this platform will help its staff, partners and global policymakers — everyone — to make better informed and timely decisions.
HungerMap LIVE is a daily reminder that many people are living without enough food. This snapshot of hunger updated is a wake-up call to the whole global community, and we hope this inspires readers to join us as we work to achieve a world of Zero Hunger.
